Last weekend, I had the chance to spend the day in NYC with my daughter. While most of our day was taken up with a college recruiting event, I couldn’t resist taking her to visit one of my favorite bookstores in the world, the Strand Bookstore at the corner of 12th and Broadway. Housing 18 miles of books, both new and used, the Strand calls out for serendipitous rather than targeted browsing. I’ve never been disappointed and never walked out with anything I would have anticipated in advance.
Last week, I stumbled upon (and bought, couldn’t resist), an out-of-print book called “The Way Things Work.” It’s actually a two-volume set, billed as “An illustrated encyclopedia of technology.” What made it irresistible to me was its structure and the fact that it was about one thousand pages of cool models. Every pair of pages consists of a brief paragraph of text describing a particular piece of technology, and on the facing page are pictures, illustrations, models. I scanned a few pages so I could share them here. Here’s the one on elevators:

And, here’s one on speakers:
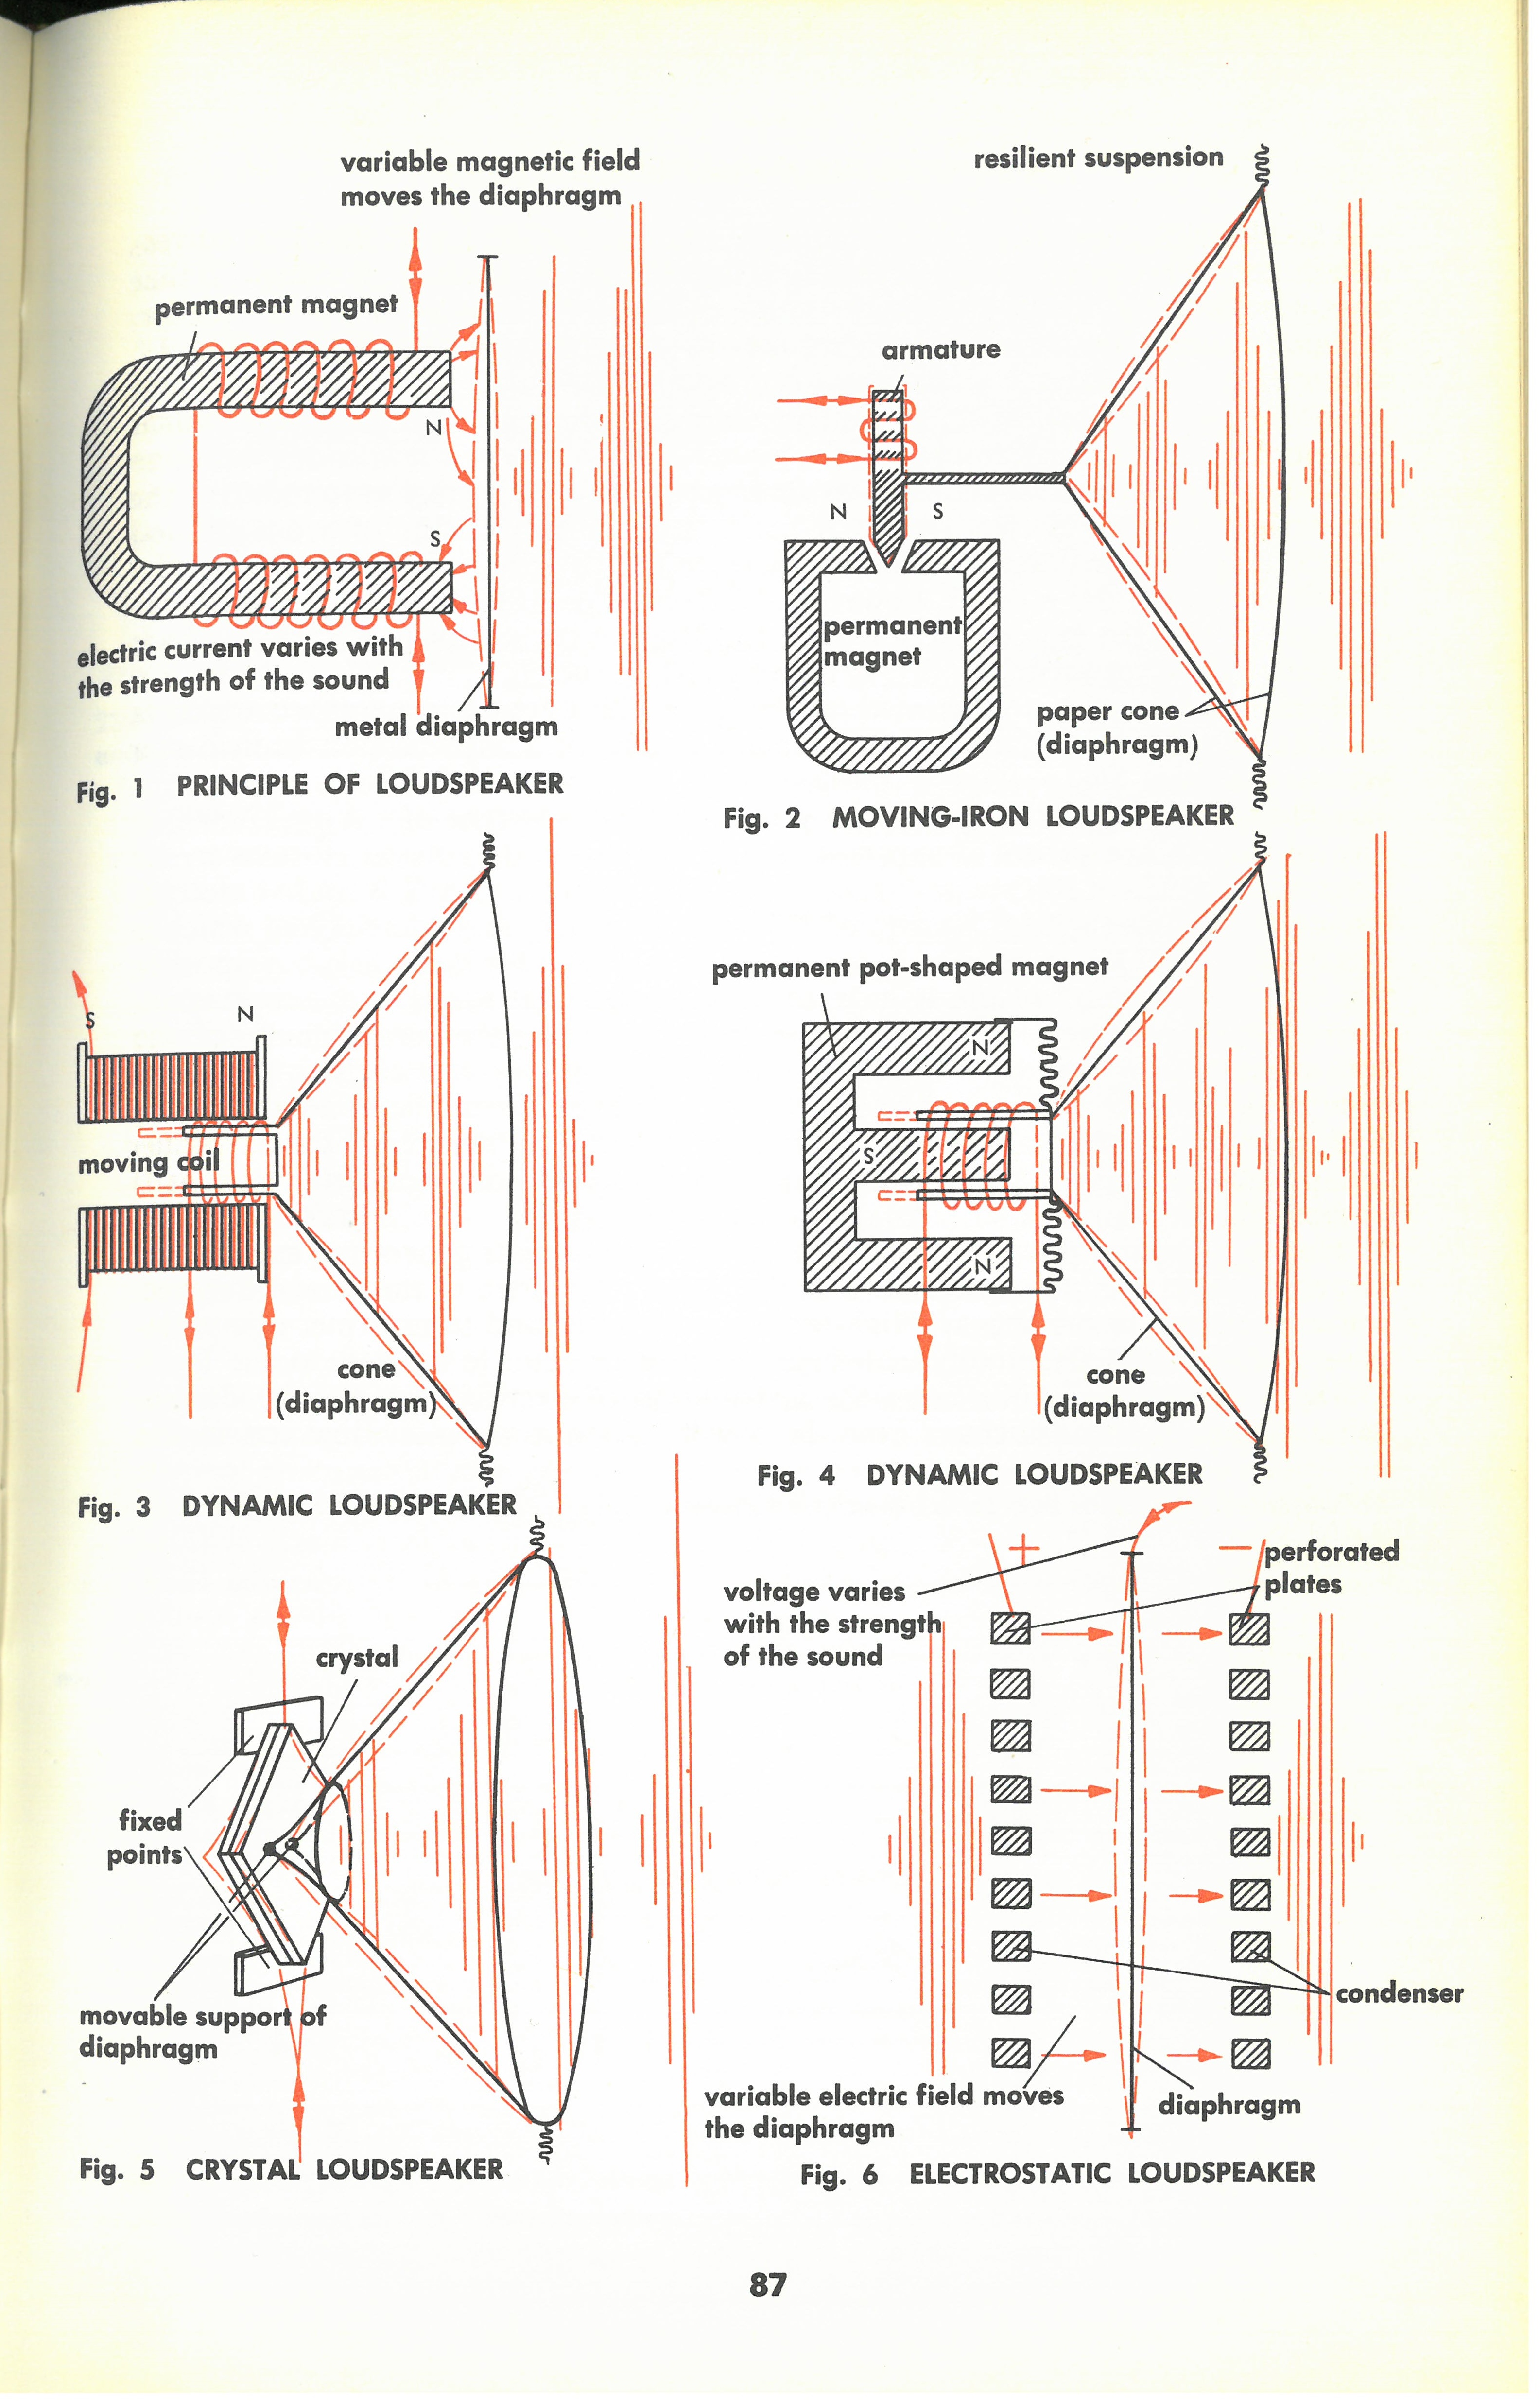
I wanted to share these pictures, these models, because they reminded me how important such models are, not only in communicating understanding, but in the mathematical modeling process. When we think about the mathematical modeling cycle and the often daunting “Formulate” phase, we often leap directly to thinking about formulating in terms of mathematics. But, that’s not what you’ll find most modelers actually doing in practice. That is, they don’t leap from “Problem” to writing down well-formulated mathematical equations describing a system. Instead, if you watch modelers at work, they’re likely to start by drawing pictures. Lots of pictures. Lots and lots of pictures. The reality is that most of us don’t think in terms of equations. We think in terms of pictures and stories and the process of sketching out a picture of the system we’re trying to understand and telling ourselves the story of the process that’s happening in the system is how we first develop understanding. As we’re sketching and talking through what we believe is happening, we’re simplifying and making approximations. We’re leaving things out of our pictures and putting other things in. We’re developing a conceptual model of what we believe is going on. We’re starting to introduce notation and often, geometry. We’re making guesses and conjectures about what’s driving what we’re observing. It’s usually only then, only after we’ve gained some simplified hold over the system, that we start to translate and turn that understanding into mathematics.
Last week, I was also reminded of the importance of pictures and story in the modeling process by a fellow named Anton (Tony) Weisstein. Tony is a mathematical biologist and teaches at Truman State University in Missouri. Much of his work focuses on developing innovative curriculum materials for the teaching and learning of mathematical biology, and much of this focuses on finding ways to teach the art of mathematical modeling to biology students. Tony was visiting the University of Delaware and I had the chance to attend a workshop he conducted on his approach.
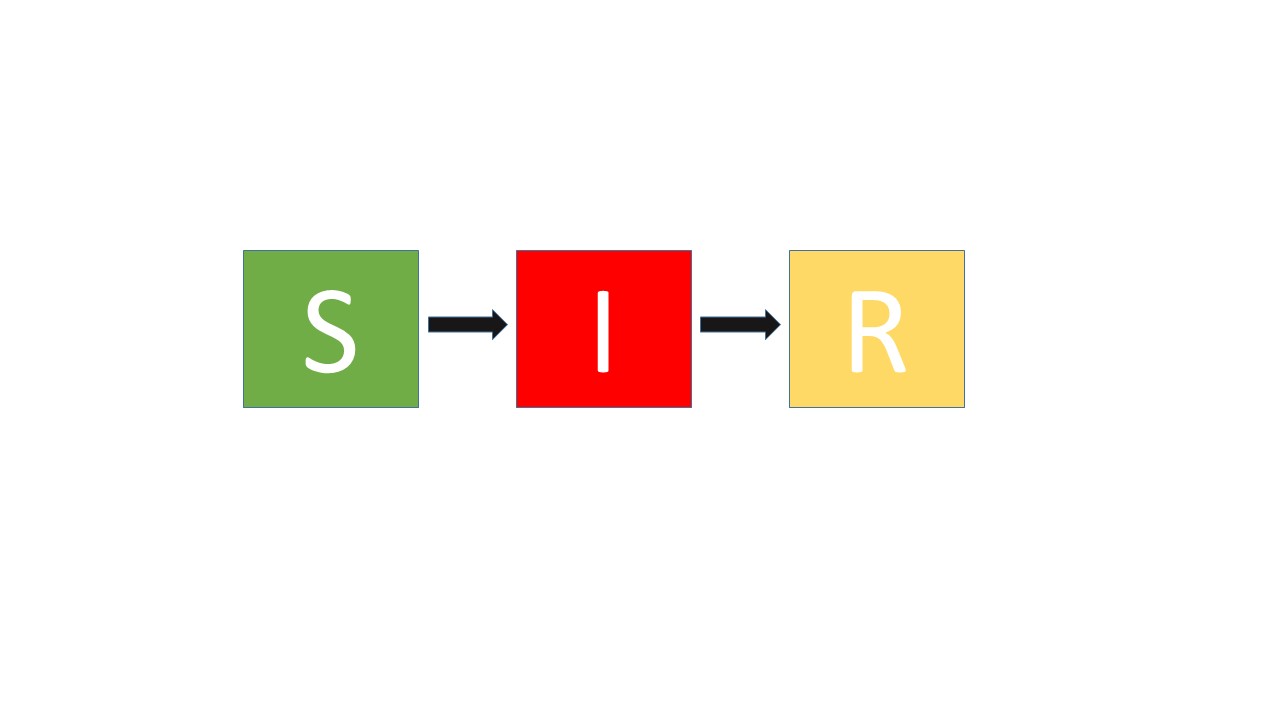
The example Tony used was the modeling of the spread of infectious disease. In mathematical biology, there is an incredibly widely used and wildly successful modeling approach to such problems known as the “S-I-R” model or the “S-I-R” class of models. When introducing his students to these models, Tony starts with a discussion of infectious disease and guides his students to slowly sketch a conceptual model of how they envision such diseases being transmitted. He draws his first sketch like this:

The discussion to this point has been about the types of individuals that could be in the population of interest. Tony’s steered the class to identify three key categories within that group. The first, “Suceptible” is represented by the box labeled “S.” This is the group of people who could get the disease. The second, “Infected” is represented by the box labeled “I.” This is the group of people who have the disease. The third, “Removed” is represented by the box labeled “R.” This is the group who has perhaps died, recovered, or otherwise been permanently removed from the population of those who could get or have the disease. Here, Tony stresses something important – he says “let’s start with the simplest possible scenario, we can always complicate things later.” He encourages students to remember or write down all those complications so that they can return and think them through later. Next, Tony focuses the discussion on the process. How can individuals move from one box to another? When the class says “Someone who is susceptible can get infected,” Tony modifies the picture to include this idea:

Further discussion leads to the idea that someone who is in “I” can move to “R” and another modification of the picture:
In this way, Tony elicits a complete conceptual model of the situation from the students before ever thinking in mathematical terms. His pictures are, to me, of the same character as the pictures from “The Way Things Work” and very much like the sketches and diagrams you’ll happen upon if you catch a mathematical modeler at work.
I’d encourage you, as you work with your students, to encourage drawing and sketching and storytelling as you and they discuss the phenomenon you’re trying to model. Building these conceptual models and clarifying your thinking by sketching and explaining the process makes your work in the “Formulate” box of the modeling cycle much easier and much more fun.
John
1 comment