It’s summer in Delaware and for me that means at least one day spent at Jungle Jim’s, a pretty neat water park in Rehoboth Delaware. While my favorite water ride is by far and away the lazy river, I do enjoy watching this guy:
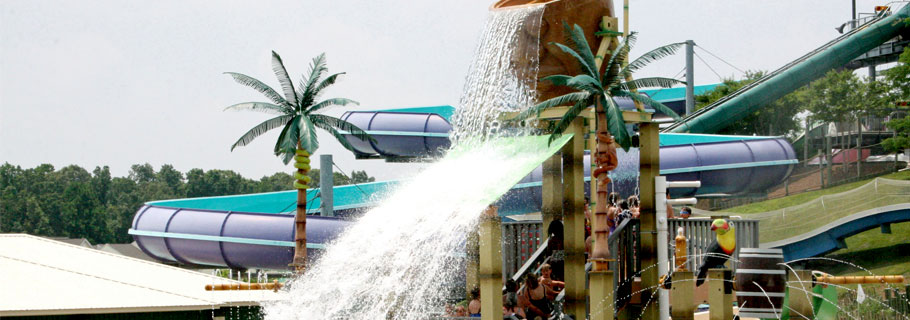
If you haven’t seen one of these before, it’s a “tipping bucket.” Basically, it’s a large bucket on a slightly off center axle with a pipe pouring water into the bucket. The bucket slowly fills, become more and more unstable, and then suddenly dumps all of its water at once on the crowd below. It then returns to its upright position and the process repeats. If you’d like to see one in action, here’s a 30 second video that will give you the idea. Or, you could take a day off and go to the water park. Your choice.
The tipping bucket is really fun to watch. The anticipation builds, you can see the crowd growing more and more anxious, and then “splash!” you get a giant bolus of water and everyone screams in delight. Every time I watch one of these, I’m thinking “periodic function,” “what’s the period?,” “when will the bucket tip?,” “how do the physical parameters of the bucket relate to the period?” and related such questions. These questions, of course, just cry out for a mathematical model!
Now, I’m not going to build a full-blown mathematical model of this system here. I’d encourage you to think about playing with this system yourself and I’m happy to talk further with anyone who’d like to try and develop this as a project for their classroom. Here, I want to point out how this simple water park novelty is a representative of a class of oscillators that are incredibly important in a whole host of areas. I’d also like to talk for a minute about how this fits in with the CCSSM high school standards on functions.
We can pretty easily sketch what a graph capturing the motion of the bucket would look like:
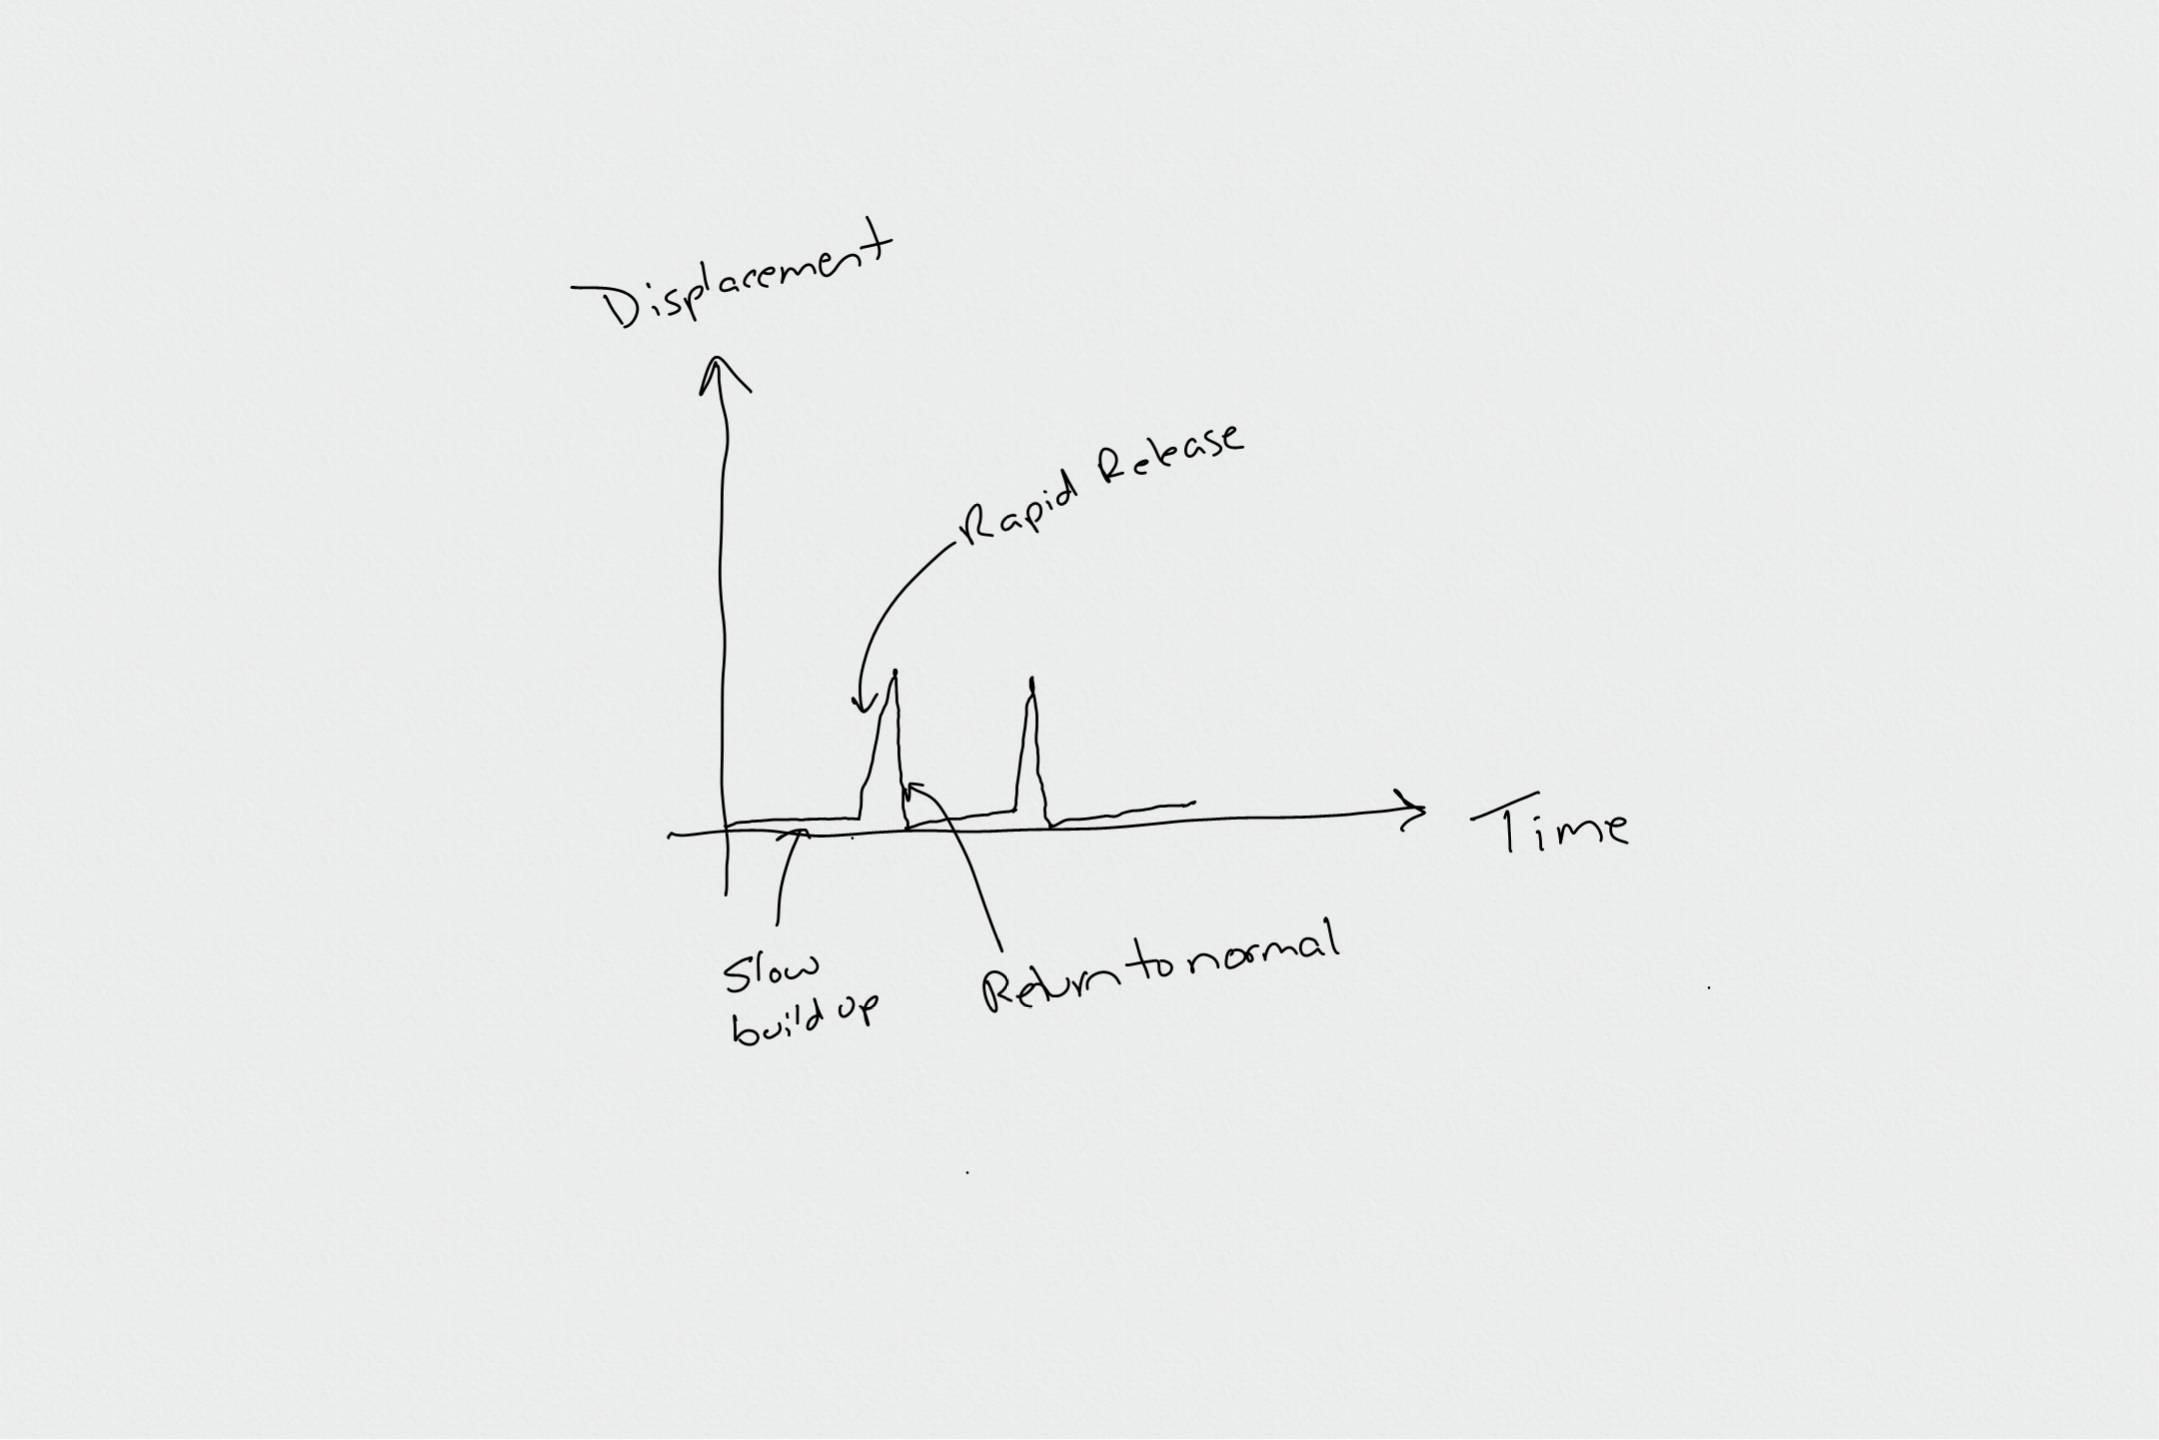
Here, we’ve plotted time on the x-axis and the bucket’s angular displacement from the upright position on the y-axis. For a relatively long time, this displacement changes very little, then, suddenly, there is a rapid change and a rapid reset back to the horizontal position. The whole graph repeats over and over, which we already imagined when we starting thinking “periodic function.” It’s pretty clear however that this isn’t a simple sinusoidal function or any of the other “typical” periodic functions we might talk about in a high school math class. That brings up the question of what the CCSSM intend when they write this:
Interpret functions that arise in applications in terms of the context.
CCSSM HSF.IF.B.4
For a function that models a relationship between two quantities, interpret key features of graphs and tables in terms of the quantities, and sketch graphs showing key features given a verbal description of the relationship. Key features include: intercepts; intervals where the function is increasing, decreasing, positive, or negative; relative maximums and minimums; symmetries; end behavior; and periodicity.*
We didn’t have to look very hard to find an example in an application that doesn’t at all look like the periodic functions they’re studying through the related standards on trigonometric functions. And, here’s where we have an opportunity to really enrich a student’s experience both mathematically and in understanding the applications of mathematics.
If you went no further in class than sketching the behavior of the tipping bucket as we did above and then leading a discussion that drove home the idea that the class of periodic functions is much bigger than the set of trigonometric functions, I’d argue you’ve already done something really important for enhancing their mathematical understanding of functions. You’ve ultimately set them up to better appreciate the magic of Fourier series later on in their studies when they see that all periodic functions can be synthesized from infinite sums of trigonometric functions. (That statement loses some magic for those who think that the only periodic functions are trigonometric functions anyway!)
At the same time, you can also introduce students to the idea of a class of oscillators and help them see the unifying power of mathematics in applications. You’ve likely already showed them multiple systems in the real world that lead to sinusoidal oscillations, now you can introduce the idea of relaxation oscillators and discuss how the tipping bucket is just one particular instance of this class.
Relaxation oscillators are characterized by the behavior we see in the tipping bucket. There is always some slow “build up” phase, a sudden release of energy, and then a return to the start of the build up phase. If you think for a moment, you can probably imagine other instances that you’ve already seen. Here’s another example:
I think it would be fun to challenge your students to go find other instances of systems that demonstrate this slow-build up/rapid release behavior. If you really want to challenge them, you can have them build one of their own:
and, then tackle the modeling problem!
– John
Hello, i’m doing a Engineering Masters project at the University of Glasgow and one of the features in the waterpark design is a “tipping bucket”. I’ve seen the tipping bucket on this website and was wondering if you’s had any calculations to find the best location for the pivot point to ensure the bucket tips all the water out and returns back to its normal position. I’ve made a prototype with an iron rod and plastic bucket and have found a rough pivot point location but need to back it up with a mathematical calculation to prove it. It would be greatly appreciated if you could get back to me
Kind Regards
Liam Tierney
Hi Liam,
That’s a very nice idea! I have not done that calculation, but would love to see what you come up with.
John