It’s winter in Delaware and while so far, it’s been a mild winter, today, we’re in the midst of a pretty good blizzard. Nonetheless, this past week I started planning my garden for the spring and thought some thoughts of spring might be nice to share today, especially for those of us on the east coast.
Last year was our first summer in our new house and so we just had a small vegetable garden in a flower bed along the back of the house. Now that I have a better sense of light and shadow, I’m ready to start planning out a small, but larger bed for this year. And, this past week, I got to thinking – Why not make it a smart garden? That is, why not make it a garden that feeds me data about temperature, water content in the soil, hours of direct sunlight, and deer. Perhaps, I thought, I could make it self-watering and responsive to all that data. So, I enlisted the aid of my 14-year old son and we did some serious brainstorming about what we’d like in a smart garden.
We dreamed up a garden that not only would return us real-time data to our phones and would automatically water itself, but that also would detect and scare off predatory deer and other such annoying creatures. We talked about the garden regulating its own temperature and automatically picking ripe tomatoes, washing them, and putting them on the kitchen counter… then, we decided to start, well, more simply.
This led us to think about sensors, and measurement, and a little bit about the mathematical models that underlie sensing. I thought I’d share some of this thinking with you today.
We decided that the most important thing we needed to measure was the moisture level in the soil. Aside from weeding, which I don’t know how to automate, watering is the next most time consuming task, and one I think we can automate. While I generally don’t mind watering the garden, I do get distracted and forget sometimes, and that’s just plain not good for tomatoes. So, the question became – how do we know how much moisture there is in the soil?
Let’s look first at the basic proof of concept demonstration that we rigged up, and then we’ll talk a little bit about indirect evidence and mathematical modeling. We used some wire, a sponge, a resistor, an LED, and a power supply, and built the following basic moisture sensor:
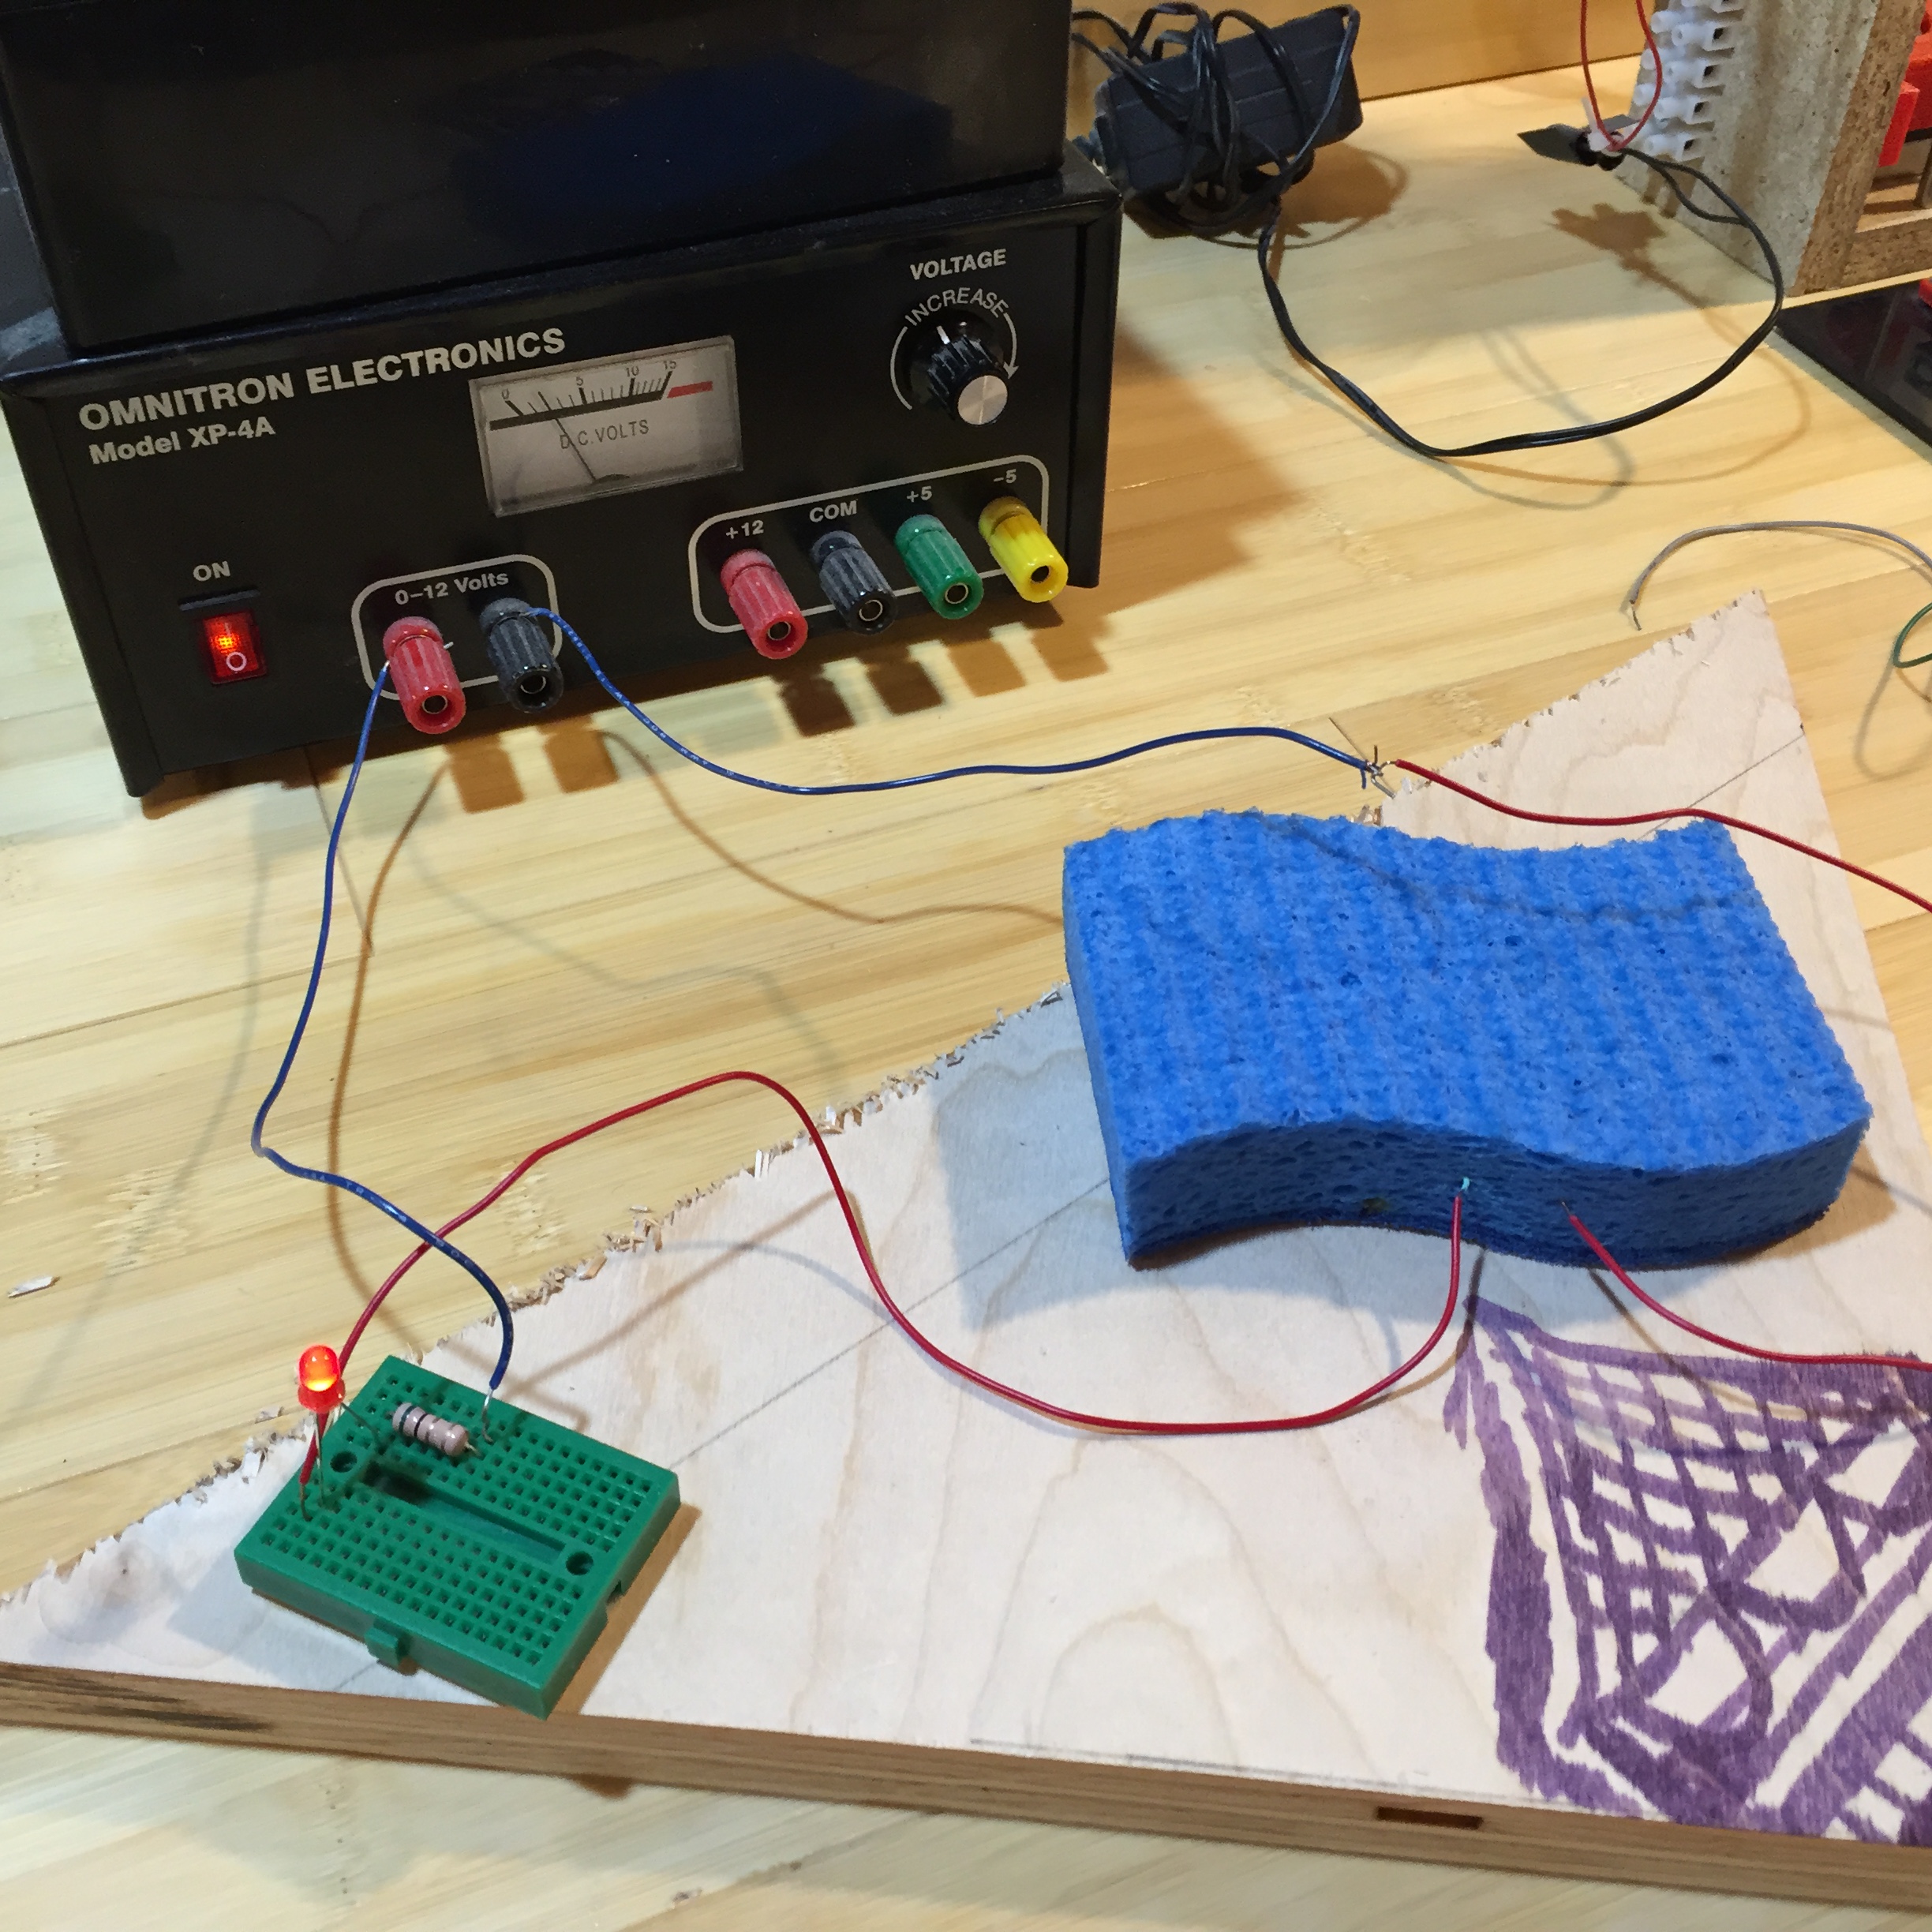
The two red wires sticking out of the sponge have about 2 inches of insulation stripped off their ends. The wires aren’t connected, rather, these two bare ends are just stuck into the sponge. If the two wires were connected, the circuit would be complete, and the LED would light up. With the two wires held a distance apart in the sponge, the circuit won’t be complete at all when the sponge is fully dry, and will exhibit various levels of resistance depending on how wet the sponge is, for a wet sponge. This means the LED will light up with differing levels of brightness depending on how much water there is in the sponge. Voila! Moisture sensor.
Now, while this is pretty crude, it illustrates the basic idea behind lots and lots of different types of sensors. The idea is built on inference from indirect evidence. We can’t directly look and see how much water is in the sponge, so we set up something we can see that changes with how much water is in the sponge, and look at that instead. If you get this, you get the idea behind lots of sensors – if you can’t look at X, look at something that you can see that changes with X and infer how X much be changing.
Now, notice, this means that we need to know the functional relationship between the resistivity of the sponge and its moisture level. We’re measuring resistivity, in this case from the brightness of the LED, and we want to infer what that means about moisture levels. That is, whether or not we can make our sensor useful or not depends on whether or not we have a mathematical model of how the resistivity of this system changes with moisture. We can think about this model very simply as this functional relationship:
(1) 
Here,  is the resistivity and
  is the moisture content of the soil. In an ideal world, this would be a simple proportional relationship, we’d look-up or measure the constant of proportionality, and we’d have a simple and useful way to determine moisture. But, of course, as in all things we want to model in the real world, things aren’t quite as simple as the ideal case! Perhaps the biggest complicating factor is that soil resistivity varies with other things that are likely to be changing in our system. In particular, it varies with temperature and with the ionic content of the water. As in any modeling problem, the question then become whether or not these impact the functional relationship we’re after to a degree that impacts this relationship in a meaningful way. Here, it may be safe to assume that ionic content doesn’t vary much over the life of the garden and we can ignore it. Temperature, on the other hand, does vary a lot, and it turns out that on the scale on which we’re trying to measure this functional relationship, the variation of temperature has a significant effect on
  . So, we really need to be thinking about a mathematical model of the form:
(2) 
Here,  is temperature. Now, there are two paths one could take to obtain and these nicely correlate with the notion of descriptive and analytic models that we’ve explored before in this space. In this context, a descriptive model of the situation is often called an empirical model. You can imagine that we could obtain by designing a set of experiments. For example, we could take a sample of soil and thoroughly dry it out in the oven, let it come to some known temperature, and then measure . We then add known quantities of water to this known volume of soil and measure along the way. We then repeat this for a bunch of different temperatures, . In this way, we build up a data set to which we can fit a curve that becomes our model, . In situations like this, and for moisture sensors, this is the general approach. An alternative, analytic path, would involve computing the resistance from first principles. That would mean we’d need a good model for the soil composition as a function of space, the resistivity of each of the constituents of the soil, the flow of water through the soil, and how all of these things respond to temperature. In this case, the complexity of such a model and the work involved in the analysis isn’t likely to be worth the payoff. It might be interesting and I’d bet that someone, somewhere has done it, but if all we’re interested in is calibrating and using our sensor, I’d go with the empirical model here.
Now, this train of thought got me to thinking about a lot of the STEM activities I’ve seen used in K-12 and how often, these involve measurement of one form or another. I’d like to encourage you, when you think about such activities, to think about the measuring you’re doing a little more deeply than you might be used to. For those very many cases where you’re doing some sort of “can’t see X, so I’ll measure something I can see that varies with X,” it’s probably worth taking a moment and having your students think through the mathematical model you’re relying upon to make that work. Hopefully this will give your students a deeper appreciation of another aspect of the interplay between S, T, E, and M. And, if your students get real ambitious and want to come design and build my new smart garden, let me know. Always open to help!
John