In his wonderful book, How Not to be Wrong: The Power of Mathematical Thinking, Jordan Ellenberg uses an excerpt from Mark Twain’s Life on the Mississippi to make an important point about fitting linear models to data. While Ellenberg’s book covers topics that extend well beyond mathematical modeling into areas one would commonly label as “quantitative reasoning,” he captures a heck of a lot about how modelers think and how a mathematical modeler approaches the world. Today, I want to borrow Ellenberg’s Mark Twain tale and discuss the importance of two words that appear in the CCSSM, namely, descriptive and analytic.
Let’s start with the excerpt from Twain’s Life of the Mississippi:
The Mississippi between Cairo and New Orleans was twelve hundred and fifteen miles long one hundred and seventy-six years ago. It was eleven hundred and eighty after the cut-off of 1722. It was one thousand and forty after the American Bend cut-off. It has lost sixty-seven miles since. Consequently its length is only nine hundred and seventy-three miles at present. . . . In the space of one hundred and seventy-six years the Lower Mississippi has shortened itself two hundred and forty-two miles. This is an average of a trifle over one mile and a third per year. Therefore, any calm person, who is not blind or idiotic, can see that in the Old Oolitic Silurian Period, just a million years ago next November, the Lower Mississippi River was upward of one million three hundred thousand miles long, and stuck out over the Gulf of Mexico like a fishing-rod. And by the same token any person can see that seven hundred and forty-two years from now the Lower Mississippi will be only a mile and three-quarters long, and Cairo and New Orleans will have joined their streets together, and be plodding comfortably along under a single mayor and a mutual board of aldermen. There is something fascinating about science. One gets such wholesale returns of conjecture out of such a trifling investment of fact.
Now, Mark Twain was a funny guy and, of course, this was intended to be a humorous passage. But, it also well-illustrates the dangers of “modeling without thinking” and that’s what I’d like to caution against here. What Mark Twain was implicitly engaging in was the practice of what the CCSSM calls descriptive modeling. And, that’s a useful and important practice, done right. But, it has its limitations and it is precisely these limitations that drive the need for what the CCSSM calls analytic modeling.
Let’s first make sure we understand Mark Twain’s analysis. How might we approach this “Mississippi shrinking” problem from a purely descriptive point of view? Well, from the excerpt above and from doing a little digging as to when the American Bend cut-off occurred, we have four data points:
Year Length (miles)
1716 1215
1722 1180
1858 1040
1883 973
It’s a simple matter to plot these data points and fit a line to our data:
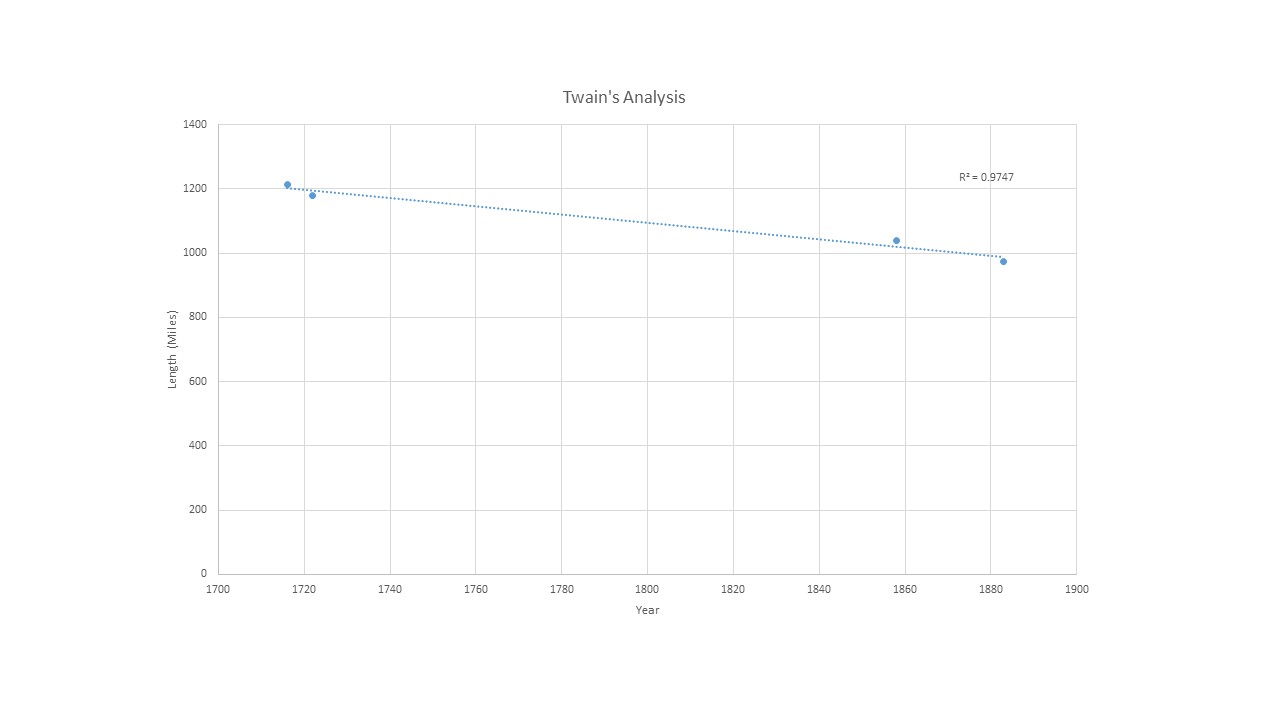
If you click on the plot and examine it closely, you’ll see that we have an R-squared value of 0.9747! Well, that’s fantastic, it means more than 97% of the variance in our data is explained by our line! So, we have a mathematical model that tells us how the Mississippi is shrinking with time and we can now make predictions, right? Well, that’s really Mark Twain’s point. We can’t. In Life on the Mississippi, Twain extracted the slope of our line and found that according to our model, the Mississippi is losing about a mile and a third of length each year. In some sense, that’s right of course. But, in a more important sense, it is horribly wrong. The sense in which that’s wrong, is the sense in which descriptive mathematical modeling is limited, and is a tool that we have to wield very carefully. It’s also why, as mathematical modelers, we’re driven to seek the deeper sort of understanding that comes from analytic modeling.
The CCSSM has this to say about descriptive modeling:
In descriptive modeling, a model simply describes the phenomena or summarizes them in a compact form. Graphs of observations are a familiar descriptive model—for example, graphs of global temperature and atmospheric CO2 over time.
That’s a pretty good description of what Twain did in his passage. What’s important to note about descriptive modeling is that it is always an extra step removed from the real-world phenomena we are trying to understand. When we do descriptive modeling, what we’re actually doing is giving some shape to a data set. We’re describing that data, saying “this data looks like this function.” Yes, we make “looks like” very precise by doing what we call “regression,” but underneath, it’s still “this data looks like this function.” And, unless the underlying phenomena continues to behave exactly as it did when it provided our data set, our description won’t be useful for making predictions. That’s where we have to very carefully think things through. Do we have any reason to believe that the trend we see will continue? If so, how far? These are always questions we should be asking whenever we do descriptive modeling.
The CCSSM also talks about analytic modeling:
Analytic modeling seeks to explain data on the basis of deeper theoretical ideas, albeit with parameters that are empirically based; for example, exponential growth of bacterial colonies (until cut-off mechanisms such as pollution or starvation intervene) follows from a constant reproduction rate.
Teaching students to understand the difference between descriptive and analytic approaches is a crucial part of teaching the art of mathematical modeling. Descriptive modeling has its time and place and in many situations its the best we can do. But, I’d argue that we should always be pushing our students deeper, pushing them to question descriptive models carefully, and pushing them to really try and understand the world by developing their skills as analytic modelers.
John