One of my favorite ways to teach mathematical modeling is through the use of hands-on activities. Often, these are “toy models” of bigger, more difficult to grasp, physical systems. Lately, I’ve been exploring the use of inexpensive, open-source sensors for the Arduino as a vehicle for getting real data from toy models. An Arduino based system allows for the integration of basic electronics, computer science, and programming into the exercise. I’d like to develop projects or systems that aid in the teaching of mathematical modeling, but also tie mathematical modeling together with the sciences in ways that can encourage a more interdisciplinary approach to teaching mathematical modeling.
My ultimate goal is to continue to develop projects aimed at supporting the teaching and learning of mathematical modeling, but that have a hands-on component. A general project structure:
1. The “big problem,” that is, the broad real-world phenomena or scenario.
2. A related analogical model system that is easy to experiment with and observe. (“Toy model.”)
3. A quantity of relevance that can easily be measured in the analogical model system via an Arduino sensor.
Project #1: The Great Lakes Problem
In this project, we’ve posed the problem of understanding pollution in the Great Lakes. This is a relevant problem, easily transferable to local contexts, a challenging problem, yet “low floor/high ceiling” mathematically, and can easily illustrate the full modeling cycle. I’ve used this many times in undergraduate courses on mathematical modeling, but never with a hands-on component. This past week at our summer New Normal academy on mathematical modeling, we tried the hands-on version.
The “Toy Model”
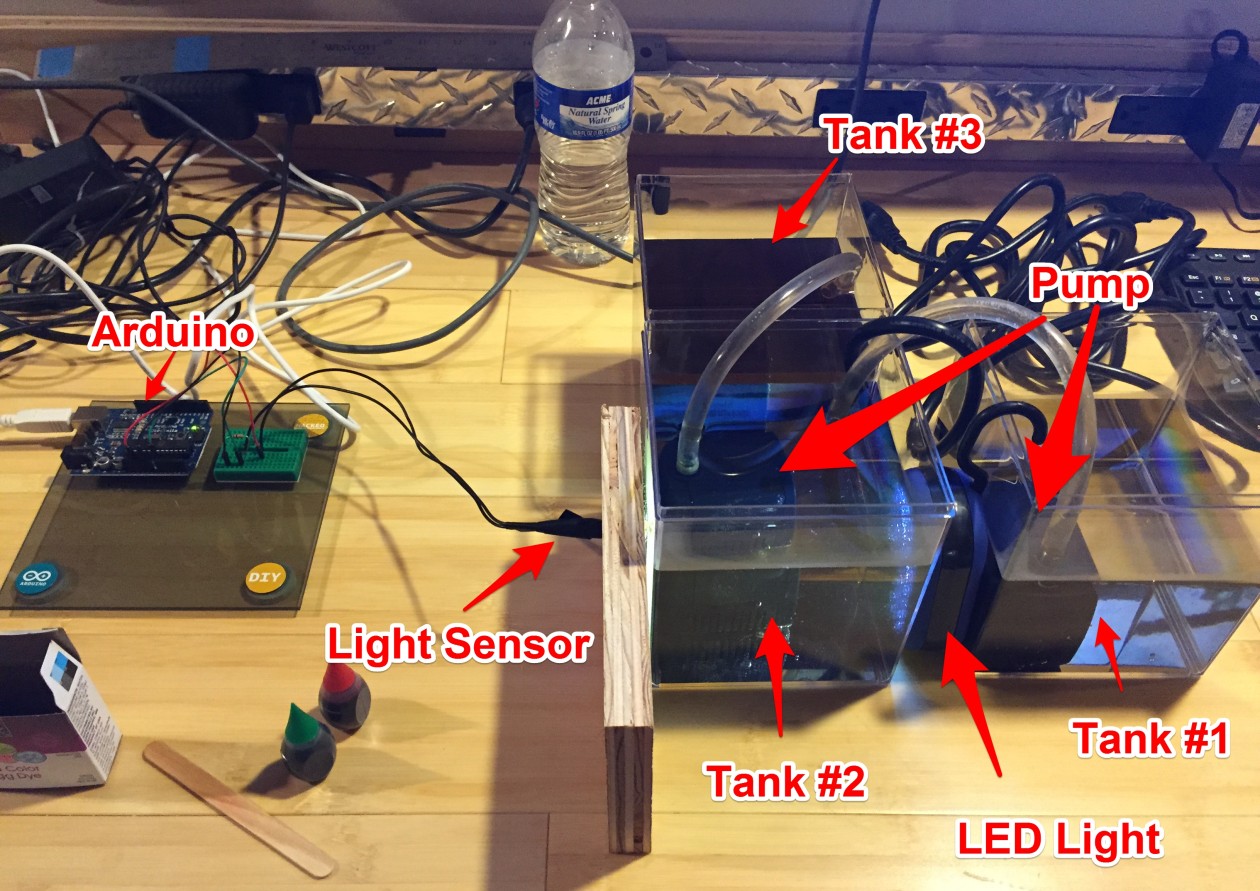
For an analogical model of the Great Lakes problem, we consider a simple system of three containers. The first container has “clean” water. The second “polluted” water dyed with food coloring, and the third is empty. Water flows from container one to container two and out of container two at the same rate. This provides a physical/analogical model of the natural cleansing of a lake under the assumption that all future pollution is stopped. A key question to investigate would be “How long would it take for the lake to reach x% polluted under this scheme?” To measure pollution levels in the system, we use a light sensor and an LED light array. The LED’s are arranged to pass through the “lake” and impinge on the sensor. As pollution levels drop, opacity of the water increases and the light sensor reacts accordingly. Sensor data can be recorded in real-time at any desired time interval using the Arduino. Here is our system:
We began with some basic tests. Light sensor readings through a clear container, no water.
With LED flashlight on opposite side, we get max reading ~995 to ~1000. Next, fill with water and see reading. No apparent change! Good.
Now, the key test, dye the water and see if we get a reduced reading. Use standard liquid red food coloring. 10 drops. Well stirred. Good! We get a change to about 967. Would like a more dramatic change, so add 5 drops of green. Great, now goes to about 823 and water appears black.
So, we have proof of concept, we can measure “contamination” in water using a simple light sensor.
Now, try pumping system and see if we can record changes. Both pumps set to lowest possible rate. We’re using a free plug-in for Arduino and Excel that lets us capture the data in real-time. Works perfectly!
.png)
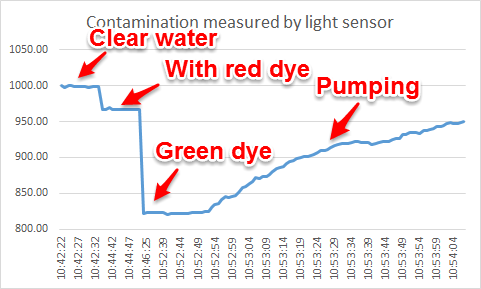
The plot above shows time vs. the light sensor reading.
What would a simple analytic model of this system look like? Identify key variables:
C(t) = Concentration of pollution in Tank #2 at time t.
V = Volume of water in Tank #2.
R = Outflow rate (assumed equal to inflow rate)
dt = A small time interval
Units:
[C(t)] = mass/L^3
[V] = L^3
[R] = L^3/time
[t] = time
[dt] = time
Basic conservation law:
C(t+dt)V = C(t)V – C(t)Rdt
That is:
Total pollution in tank at time t+dt = Total pollution in tank at time t – Amount of pollution that flowed out of the tank
Note, a quick rearrangement yields
(C(t+dt)-C(t))/dt = – (R/V) C(t)
Of course, a limit as dt tends to zero gives the standard first order ODE for exponential decay. What is of most note here is the ratio that controls the rate of decay, namely R/V. Perfectly intuitive in retrospect, this just relates how much stuff flows out to the entire volume. For the data set above, fitting tells us this ratio is about -0.015. We should ask: does the pump flow rate compared to the volume in the tank come close to 0.015? That is, would be good to do those actual measurements for our system. (Didn’t do that yet!)
Note also that one need not go to an ODE here, but could just compute on the model above. In reality, it is just a one-step Euler method applied to the ODE. What questions can this model answer?
– How long does it take for the lake to reach a given pollution level under this scenario?
One can then modify this model to include sources of pollution, coupling between lakes, etc. Another idea would be to do the case where pollution sediments out over time.
Just some random thoughts on a first attempt to use an Arduino with a toy model to do a little teaching and learning of mathematical modeling… Went well with our New Normal academy. Looking forward to developing more such activities and trying them out.
John
Personally, I find the prospect of assembling a toy model with all of the electronic components very daunting. However, many years ago I did use a CBL and Vernier probes to have my calculator collect data for use in the classroom.
I can see that and can imagine many teachers feeling as you do. One idea might be to challenge your students to do the assembling. At UD, in the Department of Mathematical Sciences, we have a hands-on laboratory just for mathematics students. When I teach mathematical modeling to undergraduates, part of their semester project is to build a version of the system they are studying, and get their own data from the system. Kids are remarkably good at this and I believe learn a lot (and find new uses for math) through this process. The wonderful thing about the age we live in is how incredibly cheap and relatively easy it is to build things. On of my favorite haunts is instructables.com, take a quick look, might give you some ideas!